 Skip to content
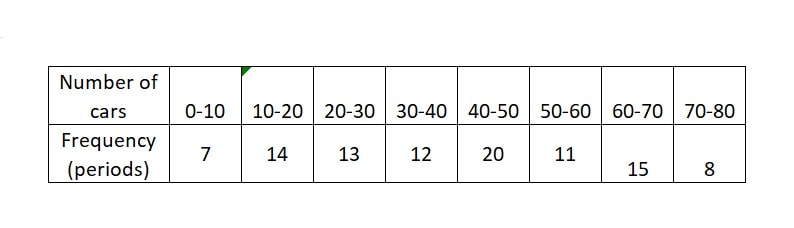
Q) A student noted the number of cars passing through a spot on a road for 100 periods each of 3 minutes and summarised it in the table given below. Find the mean and median of the following data:
Ans:
(i) Let’s re-arrange the data with midpoint of each class, frequency, and multiply midpoint with frequency:

We know that, mean of grouped data is given by:
Mean of grouped data =  = 407
= 407
Therefore, Mean value of the given data is 407
(ii) To find the median, we need to identify middle value of the data. Let’s rearrange the data.

Step 1: we need to find the cumulative frequency in the frequency table to find the median. Its shown in last column.
Step 2: Next, total number of cars or Sum of the frequencies = 100. It shown at the bottom of middle column.
Step 3: Next, we need to identify Median Class.
Since the Median class is the class where the cumulative frequency crosses 50% of the half the total number of cars. Here, 50% of total frequency is 50 and cumulative frequency is crossing is crossing at 66 i.e. at class “40-50”. Hence, our Median class = 40-50
Next, To find the median, we use the formula:
Median = L + [ x
x  ]
]
Here:
L = Lower boundary of the median class = 40
n = Total number of cars = 100
F = Cumulative frequency of the class before the median class = 46
h = Class width = 50 – 40 = 10
f = Frequency of the median class = 20
hence, the Median = 40 + [ x
x  ]
]
= 40 + [(50 – 46) x  ]
]
= 40 + 2
= 42
Therefore, Median of the given data is 42