Q) Find the mean and median of the following data:

Ans:
(i) Mean Value of data:
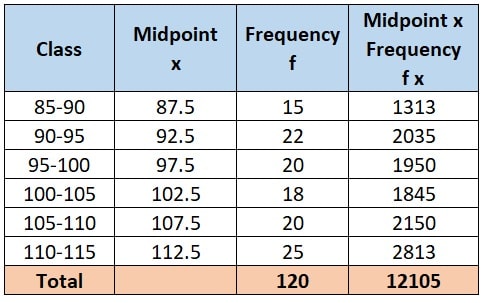
To calculate the mean value, let’s re-organize the data:

To arrange the above, we take following steps:
- We calculate midpoint ‘x’of each class by

- Then we calculate ‘fx’ by multiplying midpoint of each class with frequency of that class
- We calculate Σf by summing up all the frequencies and Σfx by adding up all the values of fx
Next, we know that, mean of grouped data is given by:
Mean of grouped data = ![]()
Therefore, Mean value = ![]() = 100.875
= 100.875
Hence, the mean value of the given data is 100.875
(ii) Median value of data:
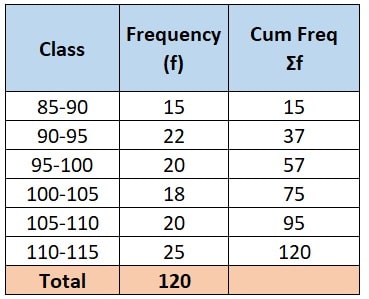
To calculate the median value, let’s re-organize the data:

To find the median, we need to first identify middle class of the data.
- We know that, Median class is the class where the cumulative frequency crosses 50% of total of frequencies.
- Here, in the given data, total of frequencies is 120 and at row 4 cumulative frequency is crossing 50% of total (i.e. 60)
- Hence, our Median class = 100-105
Next, the median value of a grouped data is given by:
Median = ![]()
Here:
L = Lower boundary of the median class = 100
n = Total number of frequencies = 120
![]() = Cumulative frequency of the class before the median class = 57
= Cumulative frequency of the class before the median class = 57
f = Frequency of the median class = 18
h = Class width = 105 – 100 = 5
hence, the Median = ![Rendered by QuickLaTeX.com 100 + \left [\frac{\frac{120}{2} - 57}{18}\right] \times 5](https://www.saplingacademy.in/wp-content/ql-cache/quicklatex.com-a02722516f1ec052a5091625ce352e69_l3.png)
⇒ 100 + [(60 – 57)] x ![]()
⇒ 100 + ![]()
⇒ 100 + 0.833
⇒ 100.833
Therefore, Median value of the grouped data is 100.833
Please do press “Heart” button if you liked the solution.
