Q) The COVID-19 pandemic, also known as coronavirus pandemic, is an ongoing pandemic of coronavirus disease caused by the transmission of severe acute respiratory syndrome coronavirus 2 (SARS-CoV-2) among humans.
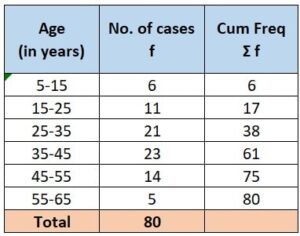
 The following tables shows the age distribution of case admitted during a day in two different hospitals

Refer to table 1
1. The average age for which maximum cases occurred is
a) 32 b) 34.36 c) 36.82 d) 42.24
2. The upper limit of modal class is
a) 15 b) 25 c) 35 d) 45
3. The mean of the given data is
a) 26.2 b) 32.4 c) 33.5 d) 35.4
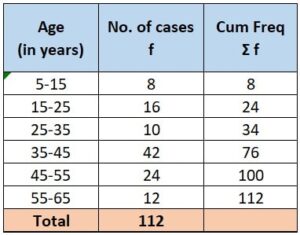
Refer to table 2
4. The mode of the given data is
a) 41.4 b) 48.2 c) 55.3 d) 64.6
5. The median of the given data is
a) 32.7 b) 40.2 c) 42.3 d) 48.6
Ans:
1. Table 1 – Average age for which maximum cases occurred:
Step 1: Here, if the average age were asked, we would have calculated the Mean value, but since the “average age of maximum cases” is asked, we will calculate the Mode value.
Step 2:  since the modal class is the class with the highest frequency.
In Table 1, class “35 – 45” has a frequency of 23, which is the highest frequency among all other classes.
Hence, the modal class is “35 – 45”.
Step 3: Now the mode of the grouped data is calculated by:
Mode = L + ![]() x h
x h
Here,
L = lower class limit of modal class = 35
![]() = frequency of modal class = 23
= frequency of modal class = 23
![]() = frequency of class proceeding to modal class = 21
= frequency of class proceeding to modal class = 21
![]() = frequency of class succeeding to modal class = 14
= frequency of class succeeding to modal class = 14
h = class size = 45 – 35 = 10
Step 4: Let’s put values in the formula and solve:
Mode = L + ![]() x h
x h
= 35 + ![]() x 10
x 10
= 35 + ![]() x 10
x 10
= 35 + ![]() = 36.82
= 36.82
Therefore, option (c) is correct.
2. Table 1 – Upper limit of modal class:
As calculated in step 2 above, the modal class is “35 – 45”.
hence the upper limit of the modal class is 45
Therefore, option (d) is correct.
3. Table 1 – Mean value:
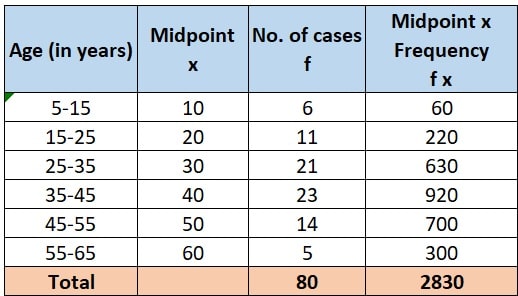
Step 5: To calculate the mean value of grouped data, let’s re-organize the given table:
 To arrange the above, we take following steps:
- calculate midpoint ‘x’ of each class by

- calculate ‘fx’ by multiplying midpoint of each class with frequency of that class
- calculate Σf by summing up all the frequencies (=80)
- calculate Σfx by adding up all the values of fx (= 2830)
Step 6: Next, we know that, mean of grouped data is given by:
Mean of grouped data = ![]()
Therefore, Mean value = ![]() = 35.4
= 35.4
Therefore, option (d) is correct.
4. Table 2 – Mode value:
Step 7: Let’s re-arrange the given data:

Since the modal class is the class with the highest frequency.
In the given question, class “35 – 45” has frequency of 42 which is the highest frequency among all other classes.
Hence, the modal class is “35 – 45”.
Step 8: Now the mode value of a grouped data is calculated by:
Mode = L + ![]() x h
x h
Here,
L = lower class limit of modal class = 35
![]() = frequency of modal class = 42
= frequency of modal class = 42
![]() = frequency of class proceeding to modal class = 10
= frequency of class proceeding to modal class = 10
![]() = frequency of class succeeding to modal class = 24
= frequency of class succeeding to modal class = 24
h = class size = 45 – 35 = 10
Step 9: Let’s put values in the formula and solve:
Mode = L + ![]() x h
x h
= 35 + ![]() x 10
x 10
= 35 + ![]() x 10
x 10
= 35 + ![]() = 41.4
= 41.4
Therefore, option (a) is correct.
5. Table 2 – Median class of data:
Step 10:  To find the median, we need to identify the median class of the data.
- We know that the median class is the class where the cumulative frequency crosses 50% of the total frequencies.
- Here, in the given data, the total of frequency is 112, and at row 4, the cumulative frequency 76 crosses 50% of the total (i.e. 56)
- Hence, our Median class = 35 – 45
Step 11: Next, the median value of a grouped data is given by:
Median = L+ ![]() x h
x h
Here:
L = Lower boundary of the median class = 35
n = Total number of frequencies = 112
![]() = Cumulative frequency of the class before the median class = 34
= Cumulative frequency of the class before the median class = 34
f = Frequency of the median class = 42
h = Class width = 45 – 35 = 10
hence, the Median = 35 + ![Rendered by QuickLaTeX.com \left [\frac{\frac{112}{2} - 34}{42}\right]](https://www.saplingacademy.in/wp-content/ql-cache/quicklatex.com-aaf51879d65cbd4698fe4ba90e5f1cae_l3.png) x 10
x 10
= 35 + ![]() x 10
x 10
= 35 + ![]() x 10
x 10
= 35 + ![]()
= 35 + 0.833 = 40.2
Therefore, option (b) is correct.
Please press the “Heart” button if you like the solution.
