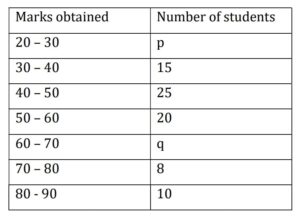
Q) The median of the following data is 50. Find the values of ‘p” and ‘q’, if the sum of all frequencies is 90. Also find the mode of the data.
Ans: Let’s re-organize the data in the frequency table and calculate the values:
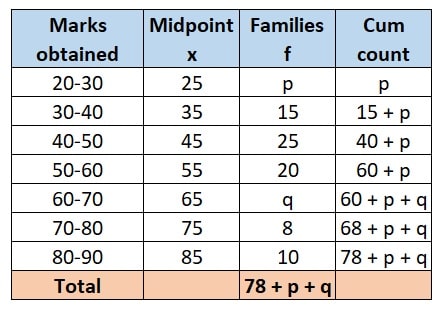
The sum of all frequencies, By summing up the families, we get:
78 + p + q = 90
p + q = 12 …….. (i)
(i) Values of p and q:
Let’s start from the median of the data. We know that to calculate median of the grouped data following are the steps:
- First, we need to find the cumulative frequency in the frequency table to find the median. Its shown in last column.
- Next, its is given that the median value of the given data is 50. therefore, it will lie in 50-60 class and hence, our Median class = 50-60.
- Next, To find the median, we use the formula:
Median = L+![\left[\frac{\frac{n}{2}-c_f}{f}\right]](https://www.saplingacademy.in/wp-content/ql-cache/quicklatex.com-fef38994fb140d4a38a5d85b95c1ce31_l3.png "Rendered by QuickLaTeX.com") x h
x h
Here:
L = Lower boundary of the median class = 50
n = Total number of students = 90 (given)
 = Cumulative frequency of the class before the median class = 40 + p
f = Frequency of the median class = 60 + p
h = Class width = 60 – 50 = 10
Hence, the Median = 50 + ![\left[\frac{\frac{90}{2} - (40 + p)}{(60 + p)}\right]](https://www.saplingacademy.in/wp-content/ql-cache/quicklatex.com-c220f1edd5ee8413e9a8bd59cb2ca035_l3.png "Rendered by QuickLaTeX.com") x 10 = 50 (given)
x 10 = 50 (given)
⇒ 50 + 10 x  = 50
= 50
⇒ 10 x  = 0
= 0
⇒  = 0
= 0
⇒ 5 – p = 0 ⇒ p = 5
from equation (i), q = 12 – p = 12 – 5 ⇒ q = 7
(ii) Mode of the data:
Since we know that, the modal class is the class with the highest frequency.
Now that we have values of p and q, in the given data (check above table), class “40 – 50” has the highest frequency of 25 (check column f)
Hence, class “40 – 50” is the modal class.
Now mode of the grouped data is calculated by:
Mode = L + ![[\frac{(f_1 - f_0)}{(2f_1 - f_0 - f_2)}]](https://www.saplingacademy.in/wp-content/ql-cache/quicklatex.com-d10771b7ef2fdab4131fb881cdfb4bbe_l3.png "Rendered by QuickLaTeX.com") x h
x h
Here,
L = lower class limit of modal class, 40
 = frequency of modal class, 25
 = frequency of class proceeding to modal class,15
 = frequency of class succeeding to modal class, 20
h = class size, 10
Let’s put values, we get
Mode = 40 + ![[\frac{(25 - 15)}{(50 - 15 - 20)}]](https://www.saplingacademy.in/wp-content/ql-cache/quicklatex.com-33de15e085c8c3112dc0074e4ee3a932_l3.png "Rendered by QuickLaTeX.com") x 10
x 10
= 40 + ![[\frac{10}{15}]](https://www.saplingacademy.in/wp-content/ql-cache/quicklatex.com-78011e3e24f9081d67a22d9554ed83bd_l3.png "Rendered by QuickLaTeX.com") x 10 = 46.67
x 10 = 46.67